HW10 summary: http://52.12.113.25/2026/03/11/hw-10-summary/
Time Log Teams – time spent on other Teams’ sites (must have 3 entries or more):
Date: Mar 08, 2026 | From: 07:10 PM | To: 07:35 PM
Date: Mar 10, 2026 | From: 11:08 PM | To: 11:40 PM
Date: Mar 12, 2026 | From: 05:04 PM | To: 05:29 PM
Time Log Students – time spent on other students’ sites (must have 3 entries or more):
Date: Mar 08, 2026 | From: 07:38 PM | To: 08:06 PM
Date: Mar 09, 2026 | From: 09:18 PM | To: 09:40 PM
Date: Mar 10, 2026 | From: 10:45 PM | To: 11:05 PM
Essay I. Summary of your activities in your contents including new contents created (one paragraph). Provide all the hyperlinks (clickable) of new contents you have created this week.
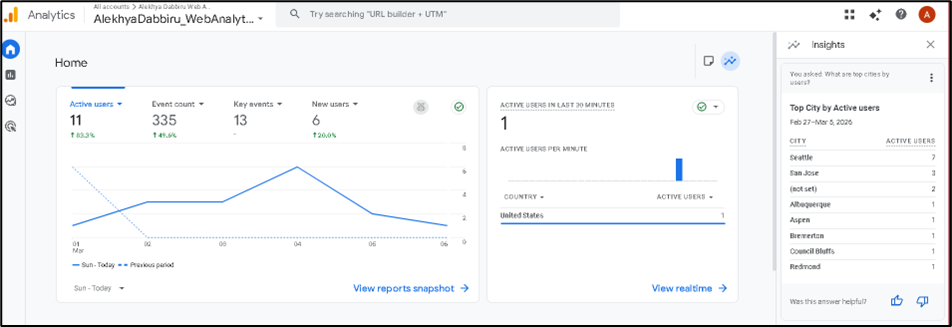
This week, I’ve monitored my website traffic using Google Analytics and created a Google Looker Studio dashboard to analyze users, sessions, event count, traffic sources, and top pages. I have also visited other teams and students websites and have left some comments on posts that I liked. For my own website, I’ve published two new posts, that are: What Is Quantum Computing and Why Is Everyone Talking About It?, and Understanding Augmented Reality and Virtual Reality, and have also added images and organized categories and tags to improve navigation. These new posts discuss emerging technologies, explaining quantum computing and the concepts and uses of AR and VR. You can access these posts via the hyperlinks below.
Hyperlinks:
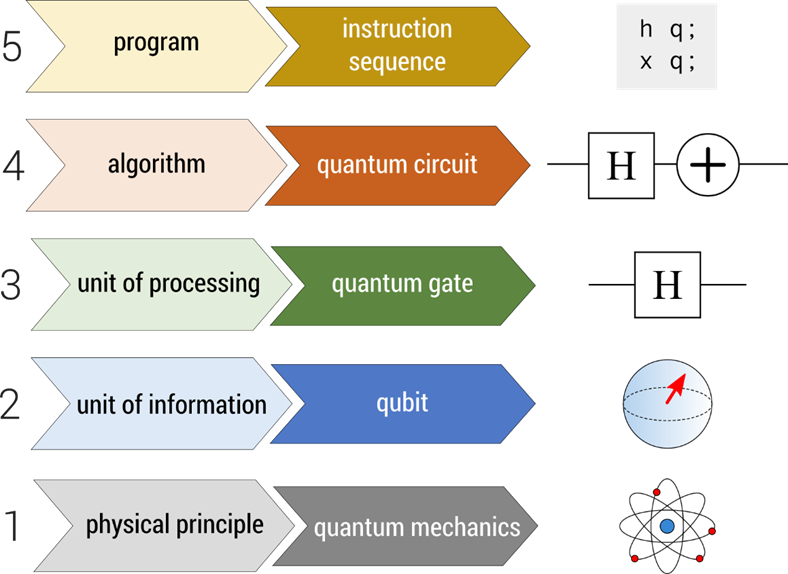
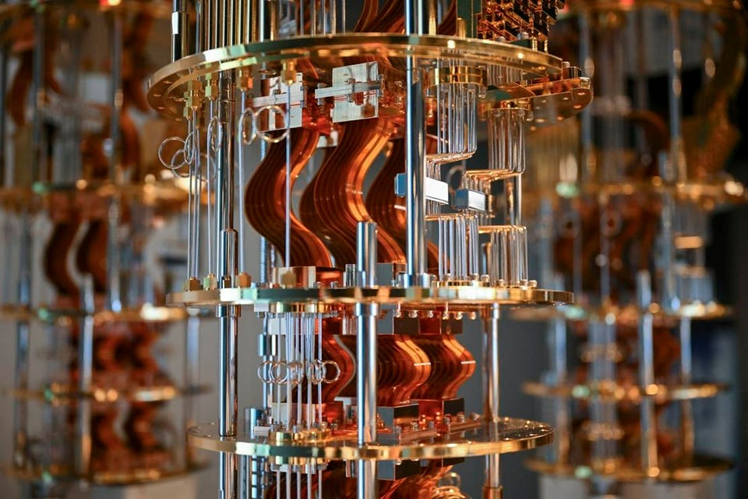
What Is Quantum Computing and Why Is Everyone Talking About It?: http://52.12.113.25/2026/03/05/what-is-quantum-computing-and-why-is-everyone-talking-about-it/
Understanding Augmented Reality and Virtual Reality: http://52.12.113.25/2026/03/09/understanding-augmented-reality-and-virtual-reality/
Essay II. Summary of your KPI table (add screenshots or table) (one paragraph excluding the KIP table)
My KPI table focuses on two main goals for my website that are increasing traffic and improving user engagement. To measure traffic, I’ve used total users and sessions because they show how many people visit the site and how often they come. To measure engagement, I used views, event count, and average engagement time because they show how users interact with my content. These KPIs help me understand my website’s performance and show whether my content is attracting and keeping visitors interested.
| GOAL | KPI | METRICS |
| Increase traffic to the website and attract more visitors to blog posts. | Number of users visiting the website. | Total Users, Sessions |
| Improve user engagement with website content and encourage visitors to explore more pages. | Average engagement with website content. | Views, Event Count, Average Engagement Time |
The table
Essay III. Summary of your Looker Studio Report with your KPI identified (add screenshots) (one paragraph) I have created a Looker Studio report by connecting my GA4 data to visualize my website’s performance. The dashboard (see screenshot below) includes charts showing total users, event count, sessions over time, traffic sources, and the most viewed pages. These charts help me understand on how the visitors interact with my website and which content attracts the most attention. The sessions chart shows how the traffic changes over time, while the table highlights the most visited posts. From the report, I have noticed that some blog posts receive more views, showing that certain topics attract more visitors.

The screenshot