Time Log Teams – time spent on other Teams’ sites (must have 3 entries or more):
Date: Mar. 4, 2026 From: 11:35pm To: 11:51pm
Date: Mar. 5 2026 From: 10:07pm To: 10:35 pm
Date: Mar. 6, 2026 From: 11:07am To: 11:25am
Time Log Students – time spent on other students’ sites (must have 3 entries or more):
Date: Mar 4, 2026 From: 11:05pm To: 11:30pm
Date: Mar. 5, 2026 From: 9:07pm To: 9:35pm
Date: Mar. 5, 2026 From: 9:35pm To: 10:05pm
Essay I. Summary of your activities in your contents including new contents created (one paragraph). Provide all the hyperlinks (clickable) of new contents you have created this week.
This week, I have checked my website traffic in Google Analytics, explored automated and custom insights, and visited team and student websites. I also created two new posts: “What Is Quantum Computing and Why Is Everyone Talking About It?” and “Understanding Natural Language Processing”. The first post explains the basics of quantum computing and why it is becoming important, while the second post discusses how NLP helps computers understand human language. These posts can be found under the ‘HW9’ section in the ‘HWS’ menu and under ‘TECH’ for general readers.
Hyperlinks:
What Is Quantum Computing and Why Is Everyone Talking About It?: http://52.12.113.25/2026/03/05/what-is-quantum-computing-and-why-is-everyone-talking-about-it/
Understanding Natural Language Processing: http://52.12.113.25/2026/03/05/understanding-natural-language-processing/
Essay II. Summary/analysis of your ‘automated insights’ (add screenshots) (one paragraph)
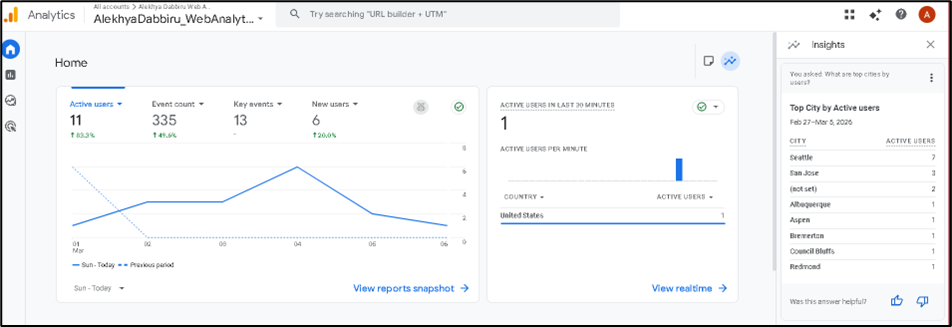
For this assignment 9, I have used Method II, in which I accessed through the Insights icon located in the top right corner of Google Analytics 4. When I opened it, the Analytics Intelligence panel showed me information about my website traffic in a quick and easy way. I asked about the top cities by users, and GA4 showed that most of my active users were coming from places like ‘Seattle’ and ‘San Jose’ during the selected dates (Sunday 3/1 – Friday 3/6). This information helped me understand visitor locations better because it presented data without requiring me to go through multiple reports. Overall, I think this feature makes the website data easier to understand.
Essay III. Summary/analysis of your ‘custom insights’ (add screenshots) (one paragraph)
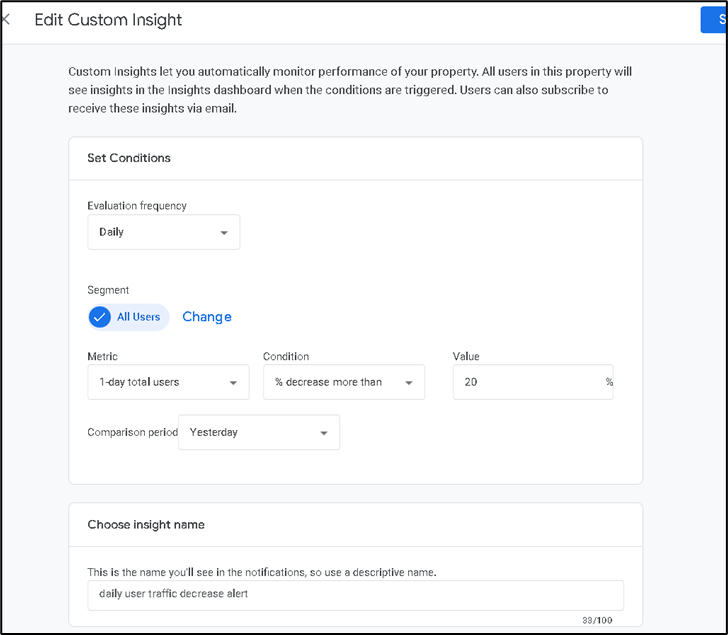
I have created a custom Insight in Google Analytics 4 to keep track of changes in my website traffic. I have set it to check daily and use 1-day total users as the metric. I also added a condition so that GA4 can notify me whenever user numbers decreased by over 20% from the previous day’s count. I think this is helpful because it makes it easier to notice sudden changes in traffic without having to keep checking reports all the time.
Leave a Reply